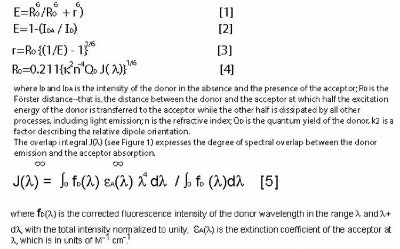
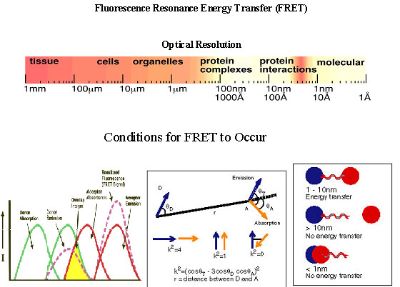
Fluorescence resonance energy transfer (FRET) is a process involving the radiationless transfer of energy from a donor fluorophore to an appropriately positioned acceptor fluorophore. FRET can occur when the emission spectrum of a donor fluorophore significantly overlaps (>30%) the absorption spectrum of an acceptor (see Figure 1), provided that the donor and acceptor fluorophores dipoles are in favorable mutual orientation. Because the efficiency of energy transfer varies inversely with the sixth power of the distance separating the donor and acceptor fluorophores, the distance over which FRET can occur is limited to between 1-10 nm. When the spectral, dipole orientation, and distance criteria are satisfied, illumination of the donor fluorophore results in sensitized fluorescence emission from the acceptor, indicating that the tagged proteins are separated by <.10 nm.
Within the living cell, interacting proteins are assembled into molecular machines that function to control cellular homeostasis. These protein assemblies are traditionally studied using biophysical or biochemical methods such as affinity chromatography or co-immunoprecipitation. Recently, two-hybrid and phage-display methods have been used for detecting protein-protein interactions. These in vitro screening methods have the advantage of providing direct access to the genetic information encoding unknown protein partners. These techniques do not allow direct access to interactions of these protein partners in their natural environment inside the living cell, but using the approach of fluorescence resonance energy transfer (FRET) microscopy, this information can be obtained from single living cells with nanometer resolution.
The widely used donor and acceptor fluorophores for FRET studies come from a class of autofluorescent proteins, called Green Fluorescent Proteins (GFPs). The spectroscopic properties that are carefully considered in selecting GFPs as workable FRET pairs include: sufficient separation in excitation spectra for selective stimulation of the donor GFP, an overlap (>30%) between the emission spectrum of the donor and the excitation spectrum of the acceptor to obtain efficient energy transfer and reasonable separation in emission spectra between donor and acceptor GFPs to allow independent measurement of the fluorescence of each fluorophore. GFP-based FRET imaging methods have been instrumental in determining the compartmentalization and functional organization of living cells and for tracing the movement of proteins inside cells.
One of the important conditions for FRET to occur is the overlap of the emission spectrum of the donor with the absorption spectrum of the acceptor. As a result of spectral overlap, the FRET signal is always contaminated by donor emission into the acceptor channel and by the excitation of acceptor molecules by the donor excitation wavelength (see Figure 1). Both of these signals are termed spectral bleed-through (SBT) signal into the acceptor channel. In principle, the SBT signal is same for 1p- or 2p-FRET microscopy. In addition to SBT, the FRET signals in the acceptor channel also require correction for spectral sensitivity variations in donor and acceptor c hannels, autofluorescence, and detector and optical noise, which contaminate the FRET signal. How to correct the contaminated signals is explained in data process part.
| |||||||||||||||||||||